
❓ Why this project?

01 Customer retention
The team aimed to have >50% of retailers return to retailer insights by end of year.
03 Customer onboarding
The team aimed to onboard new retailers.
02 Task Success rate
Since it was an MVP product offering, tracking task success was an important metric for the team.
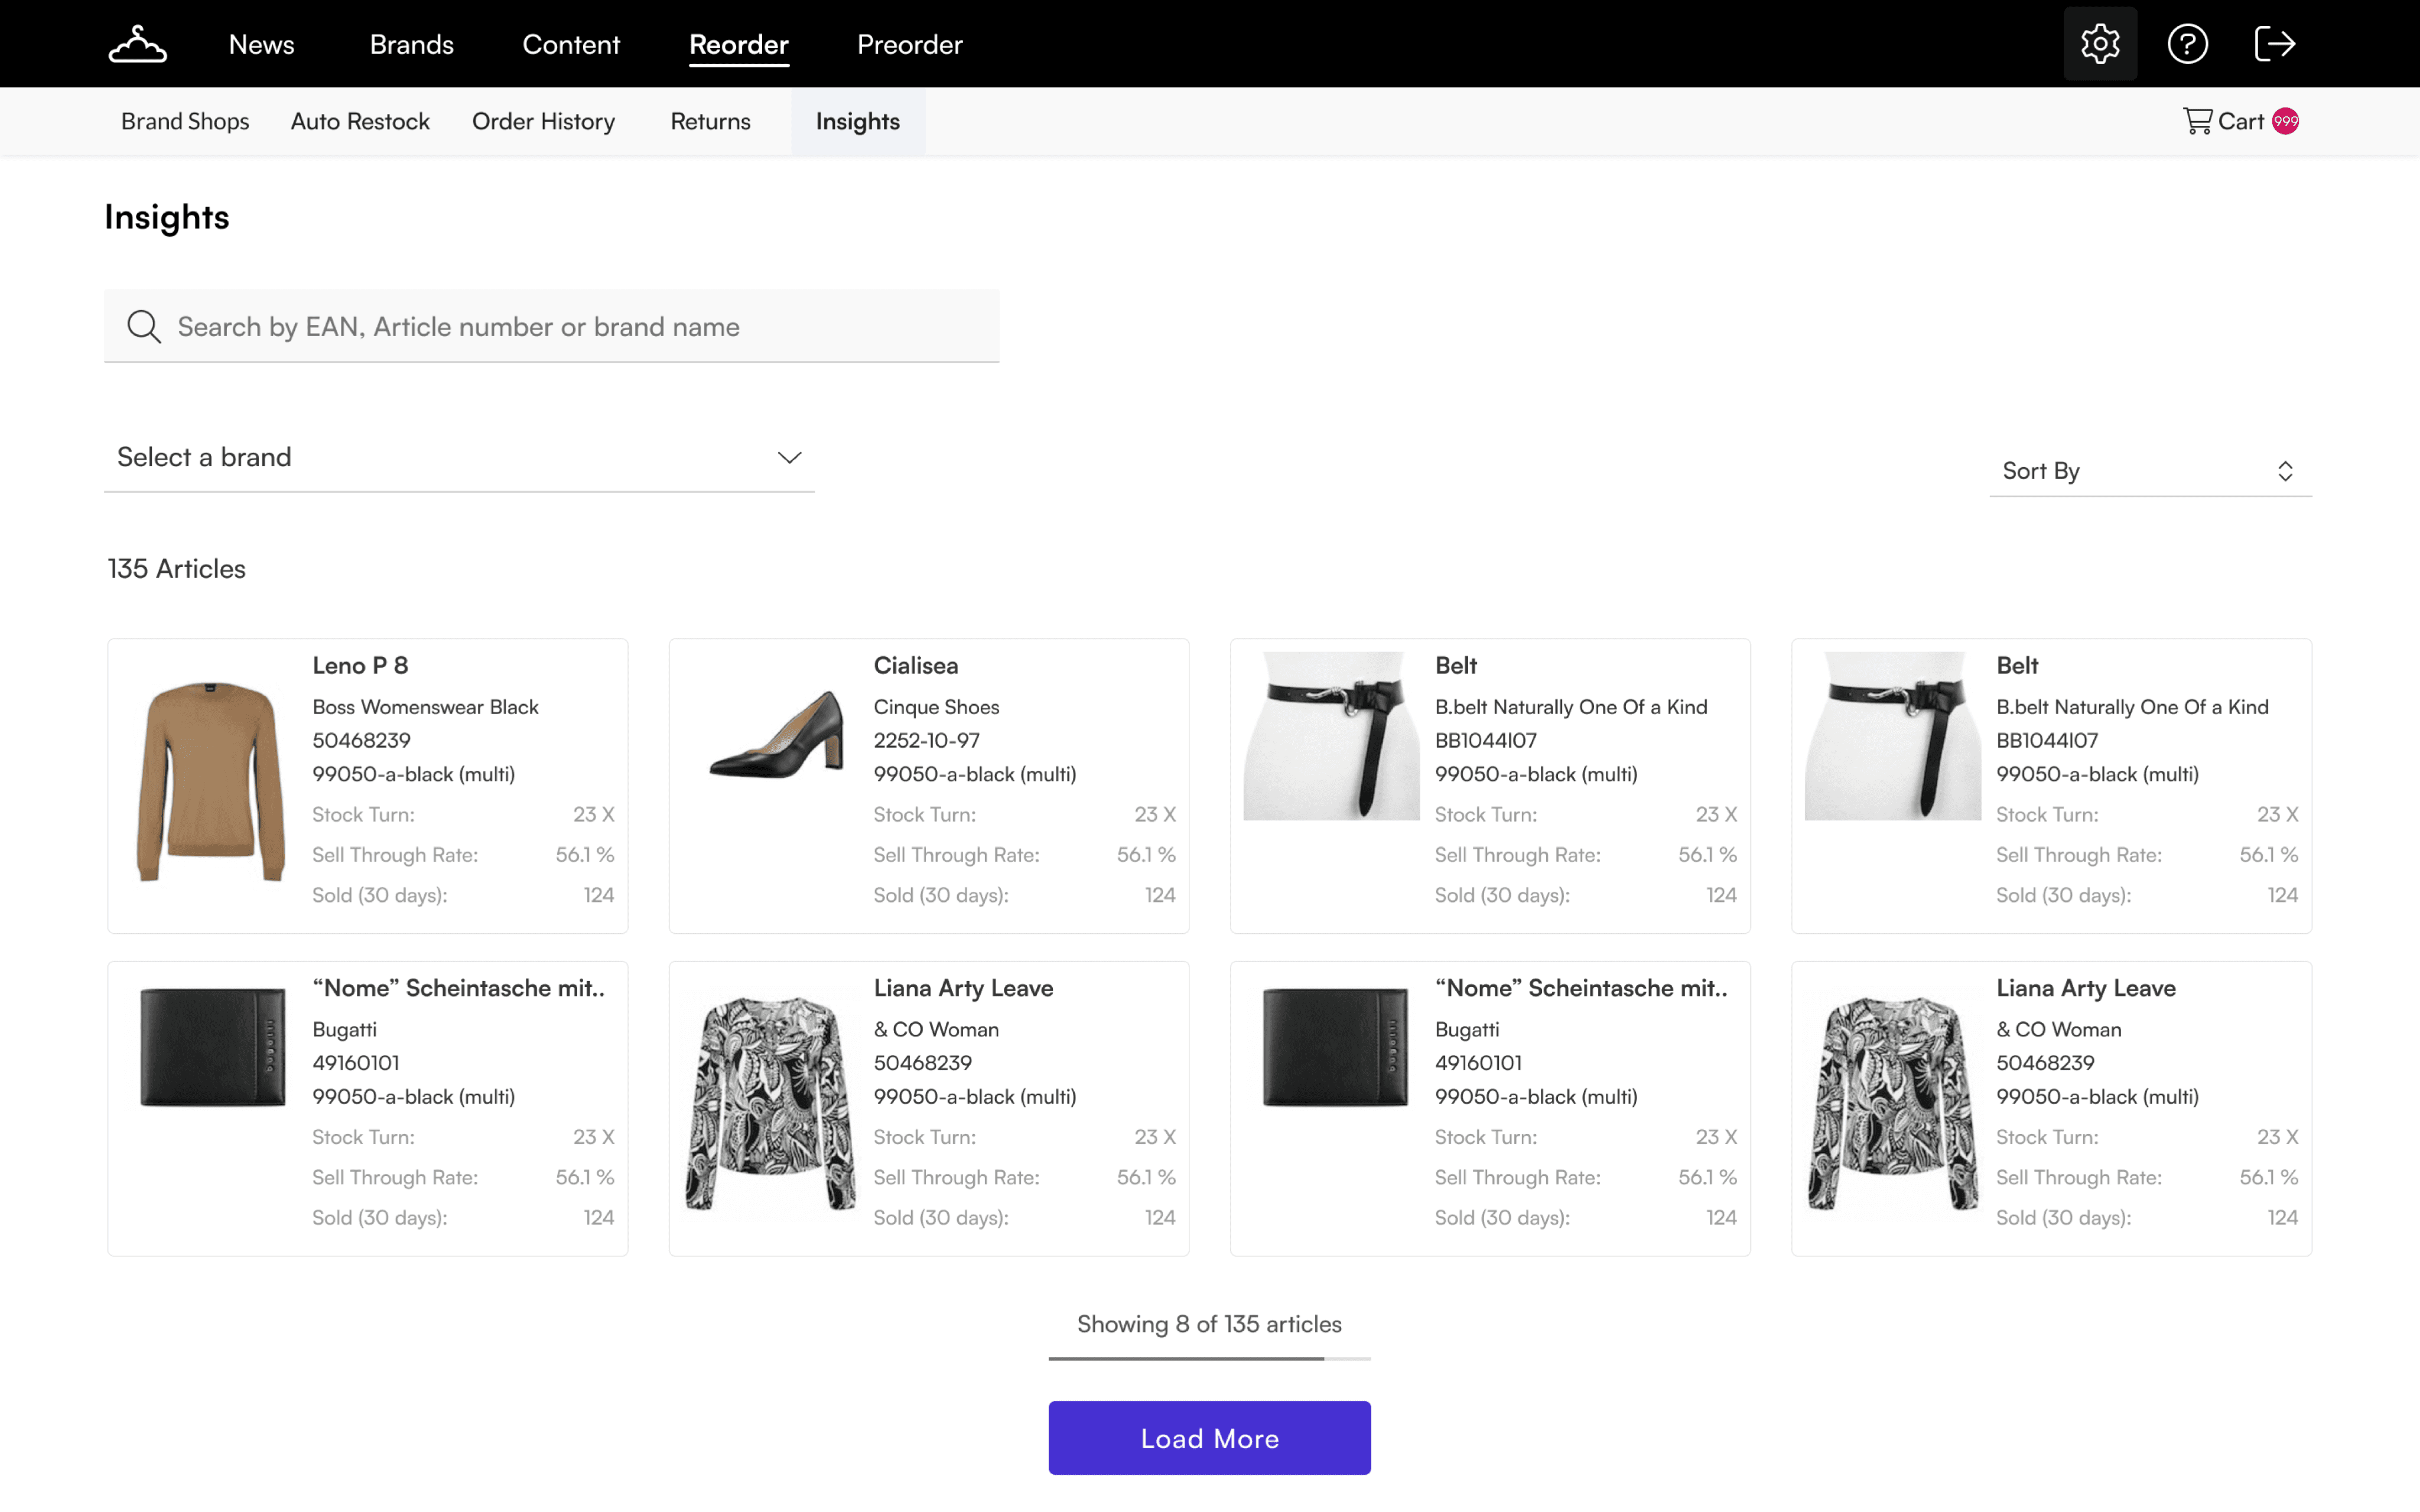
📊 Presenting Retailer Insights as solution
The solution aimed to help the retailers look at their articles from different brands at a deeper level by interacting with them.
💼 Business goals
Onboard more retailers onto the platform driving increase in company revenue by 30%.
✅ How did it solve?
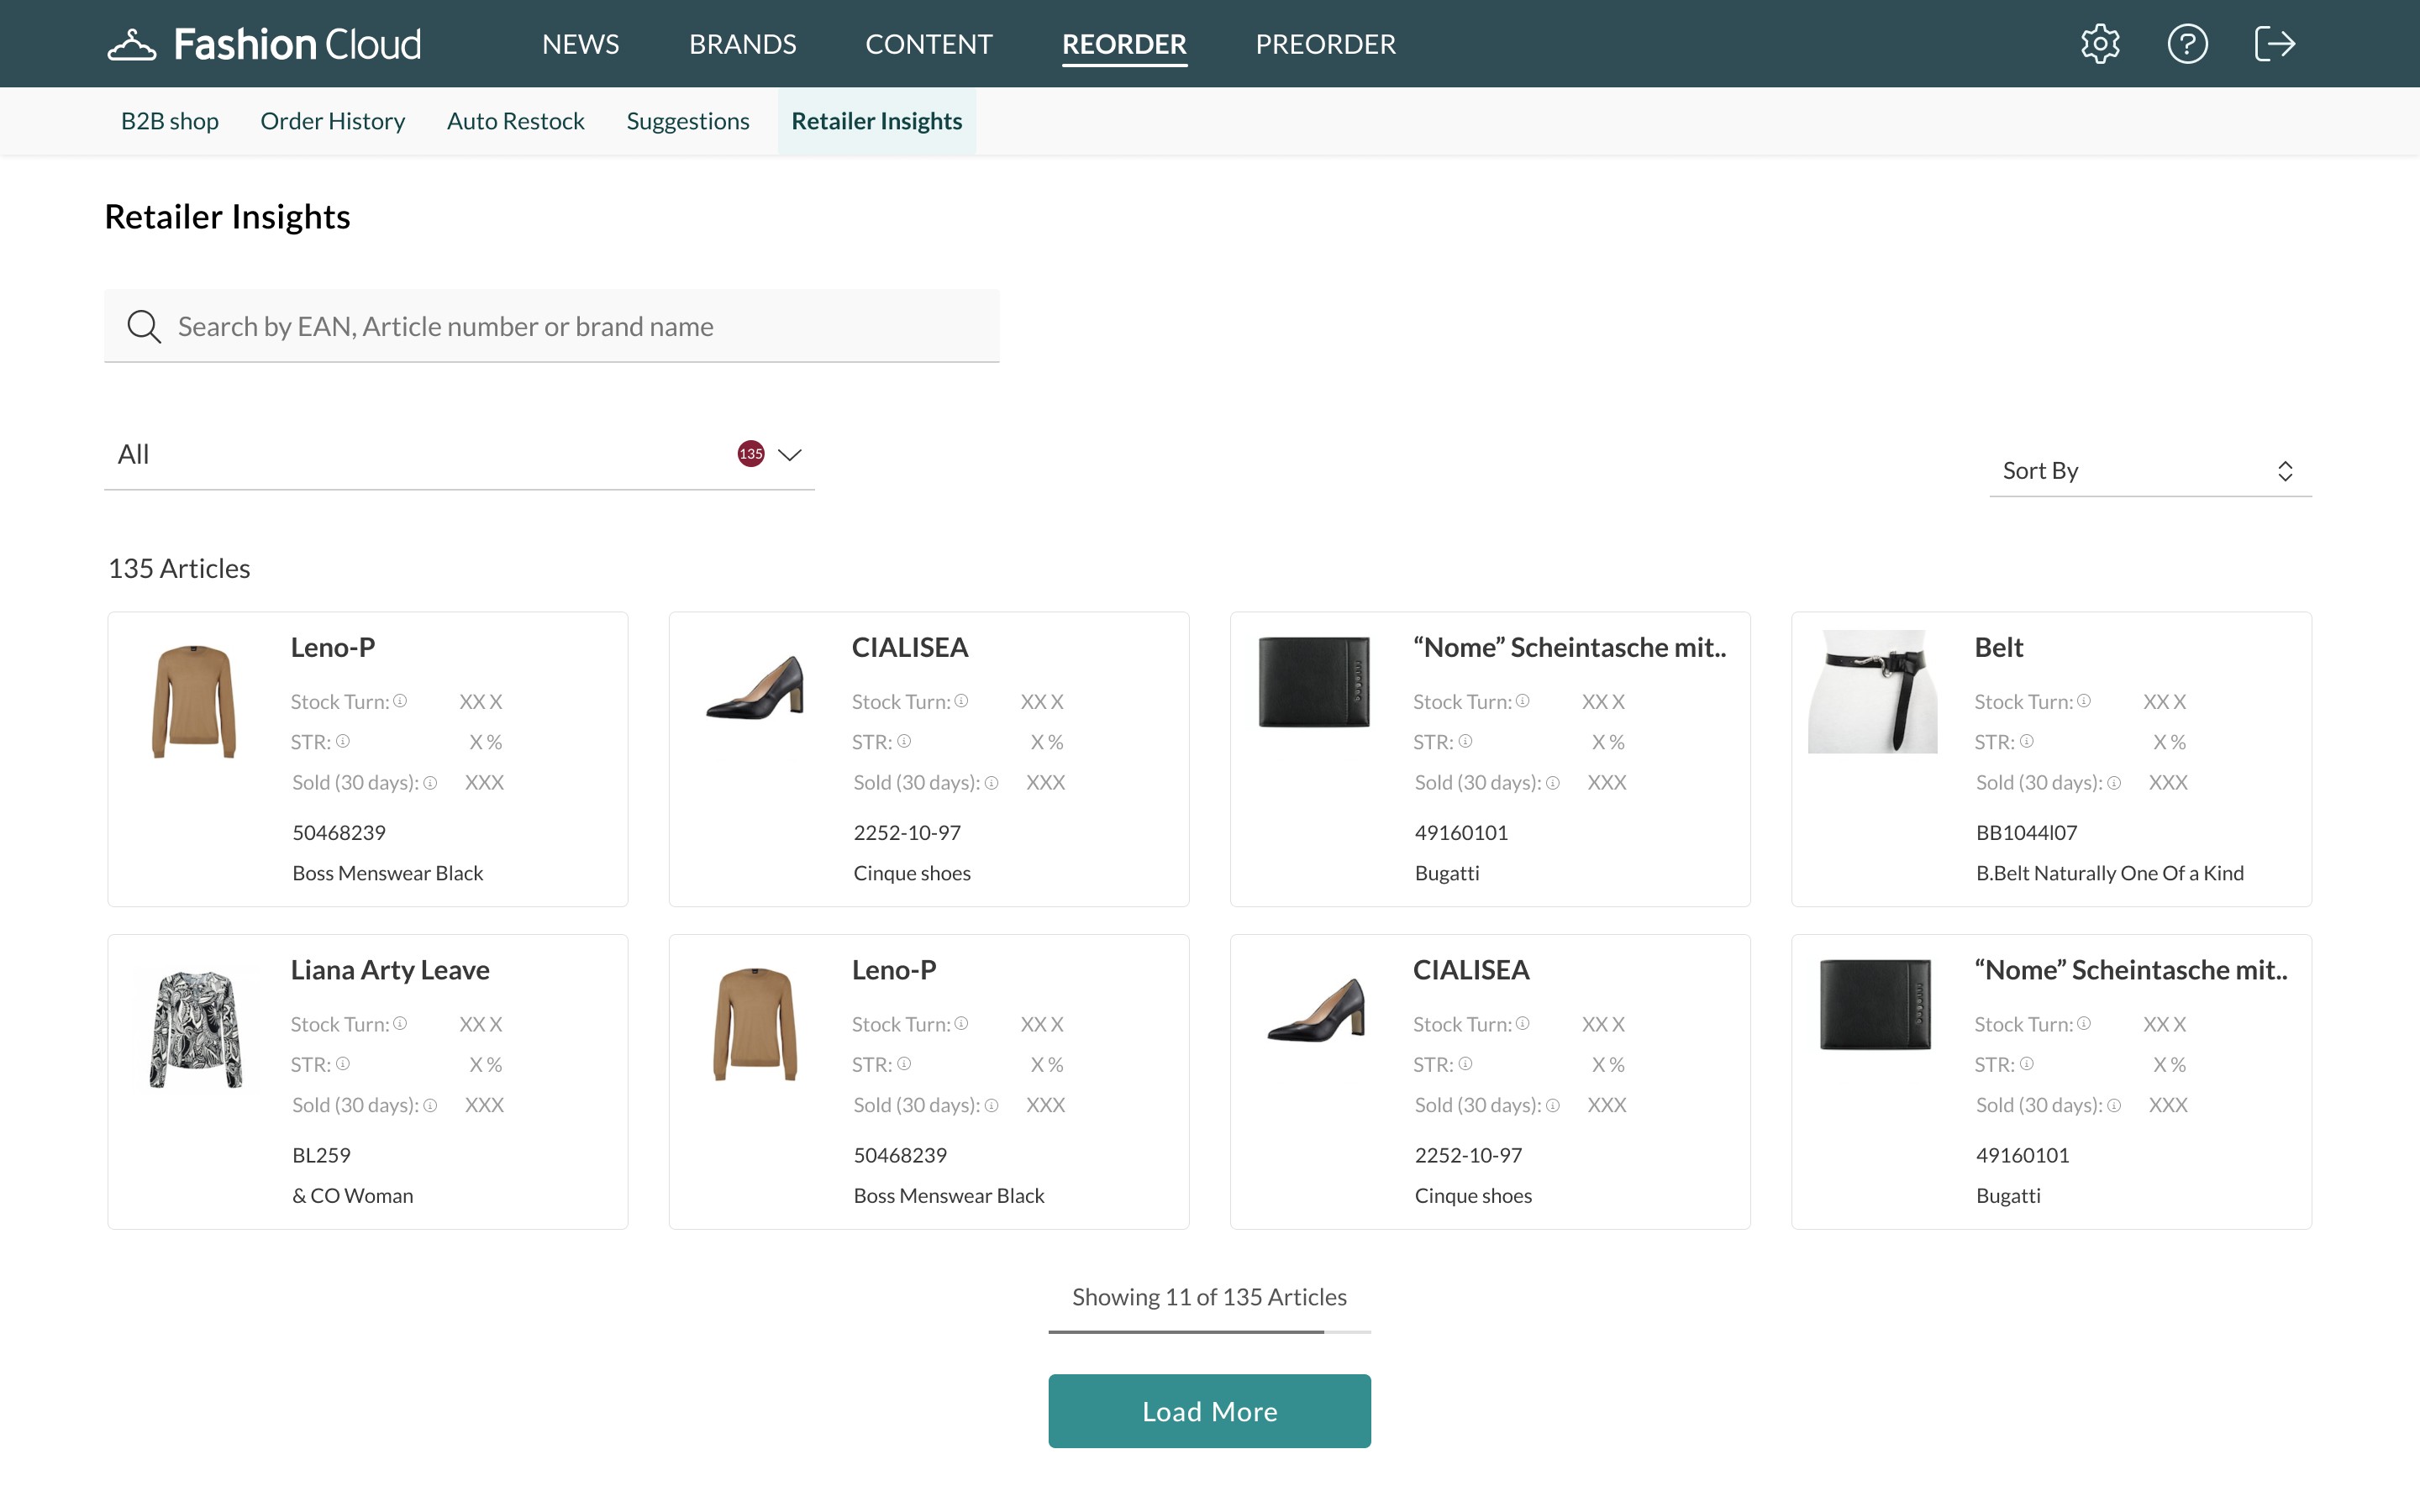
As a part of survey response, the retailers shared they commonly view the data in form of a table but they were missing article image.
The cards give visual context about how an article may look instead of only textual data.
Through the process, I conducted surveys to gauge user behaviour about the existing article card browsing experience, 50% of retailers shared the pain-point of not being able to review article performance and having to manually access reports and connect dots. This pushed me to solve for a unified cross-brand article view with the potential to scale for starters.
01 Where can I see all the articles from brands I order to check their performance?
The Insights allows user to glance through articles across different brands simply by applying certain filters like brand selector, period, etc.
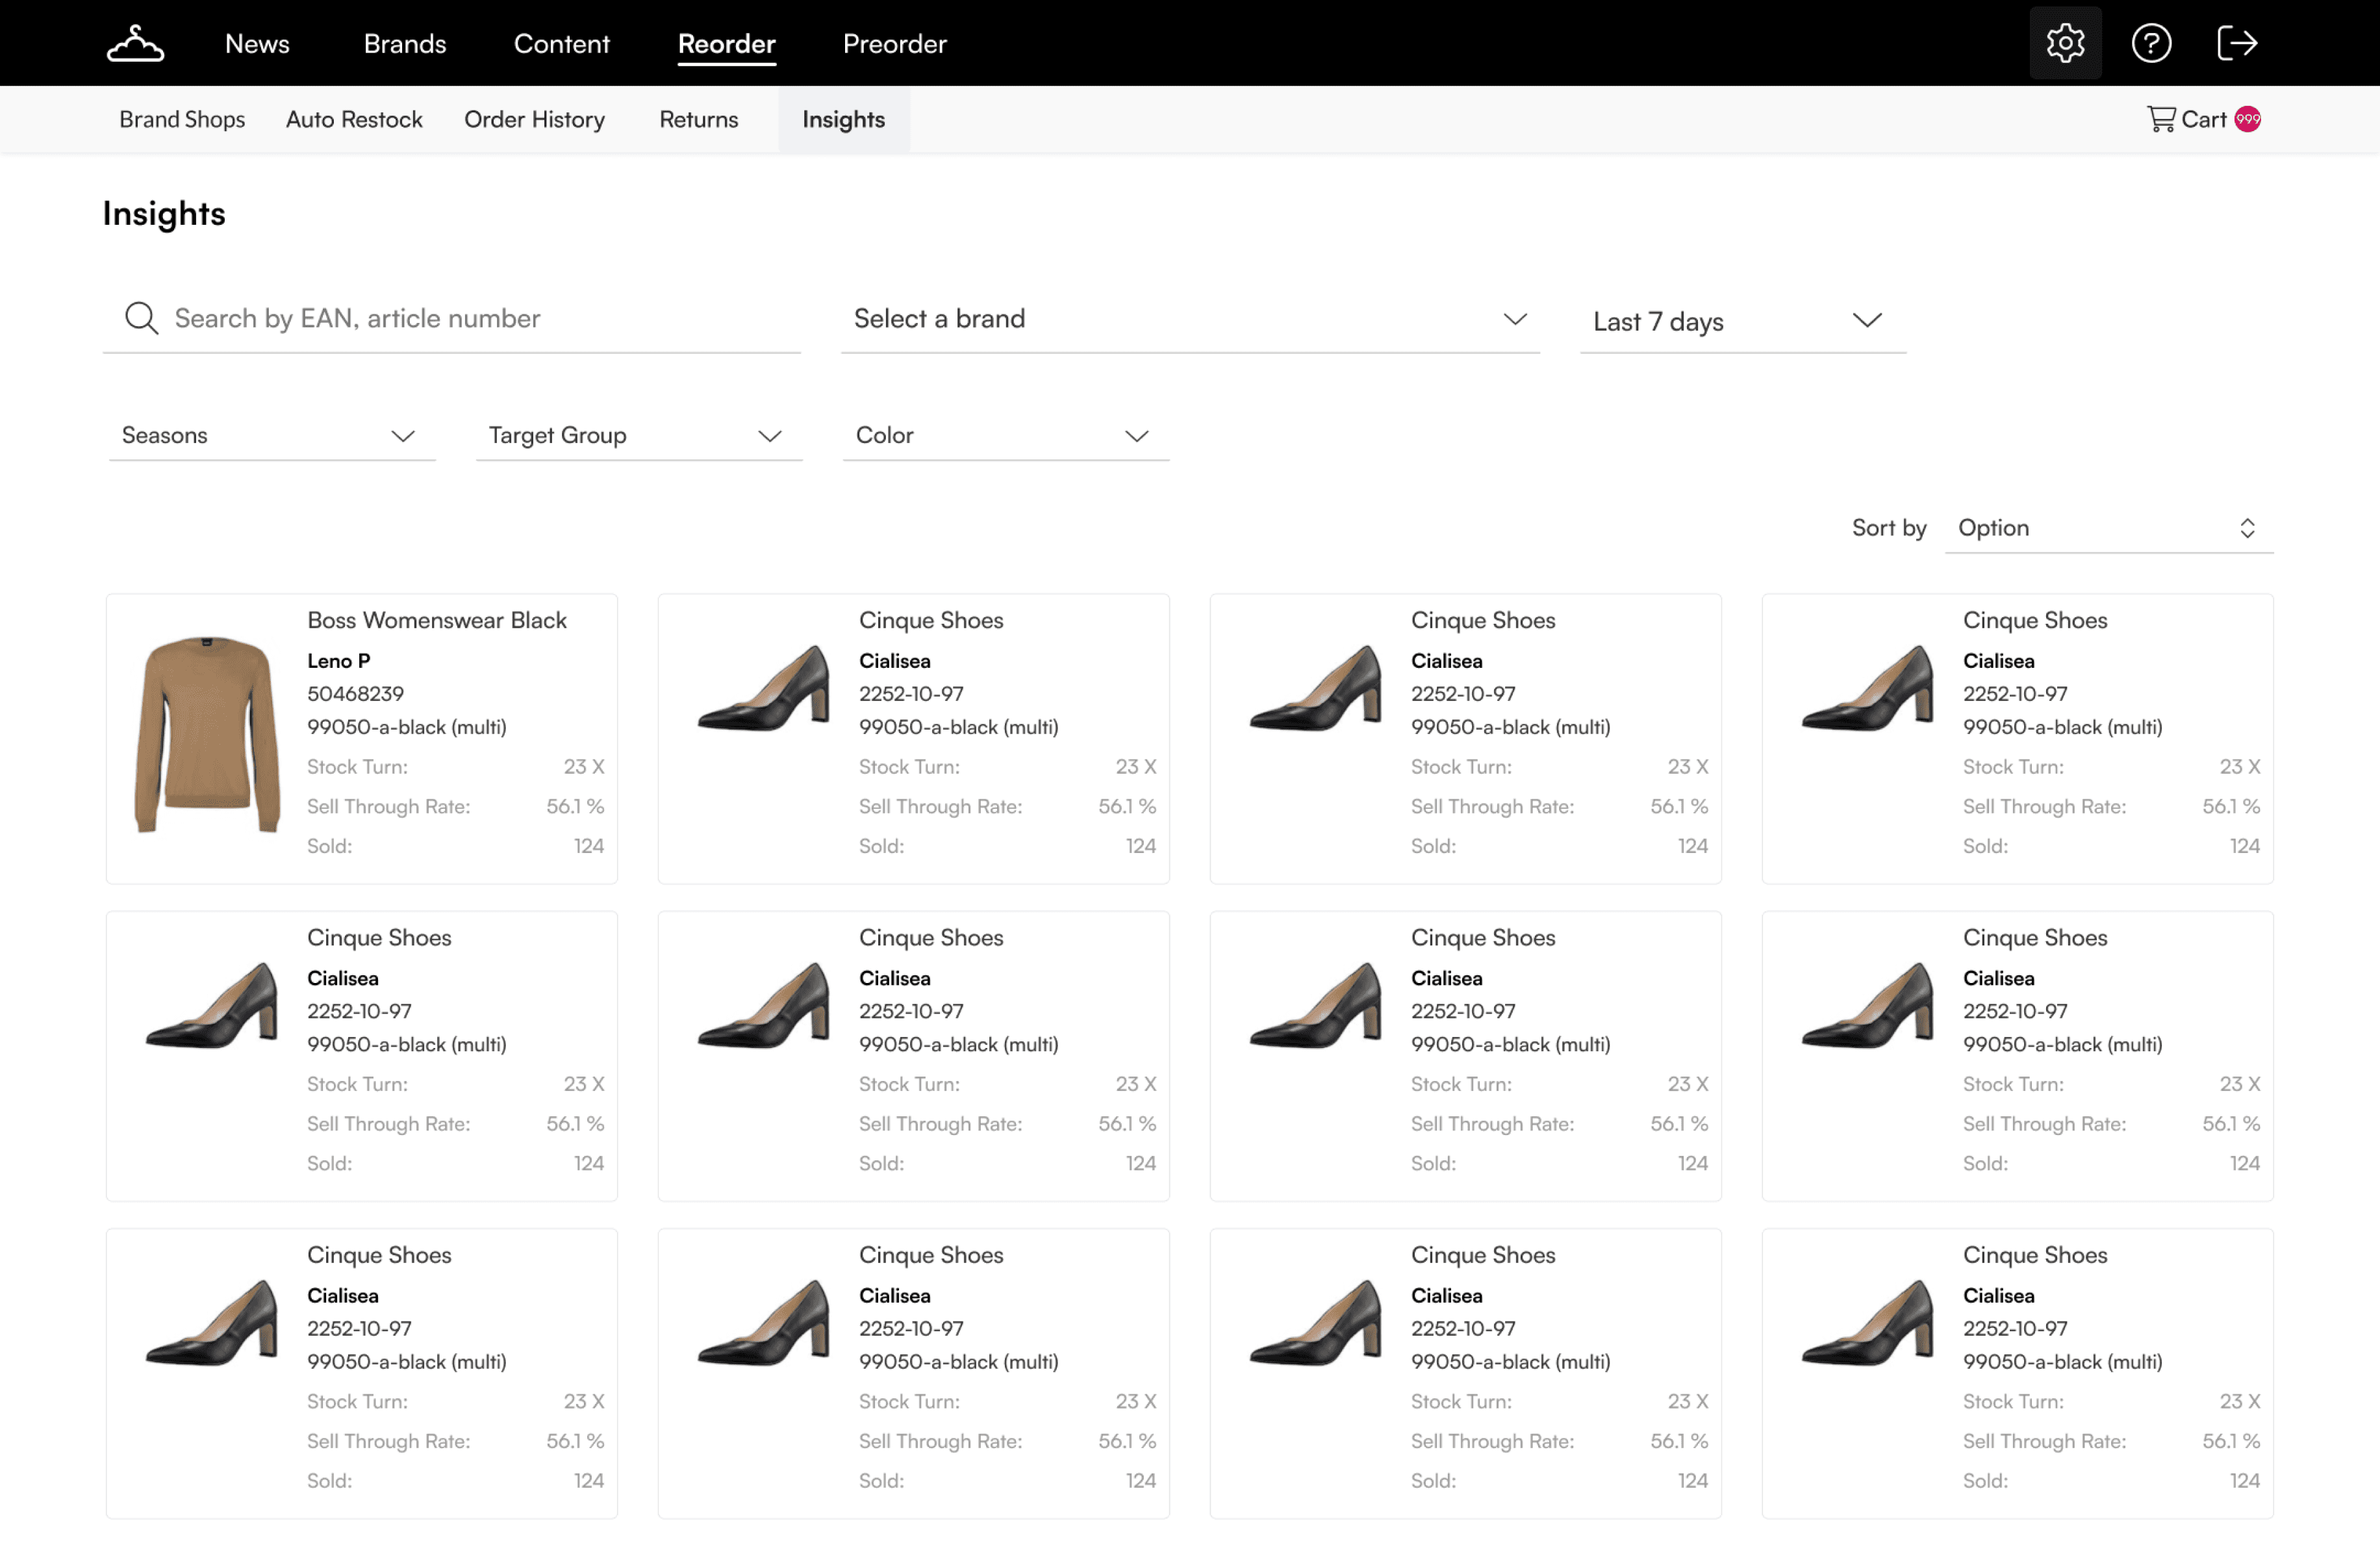
02 What if there are no insights?
Guiding the user when there isn’t any size metrics available gives enough affordance
to know the platform is still aggregating the data.

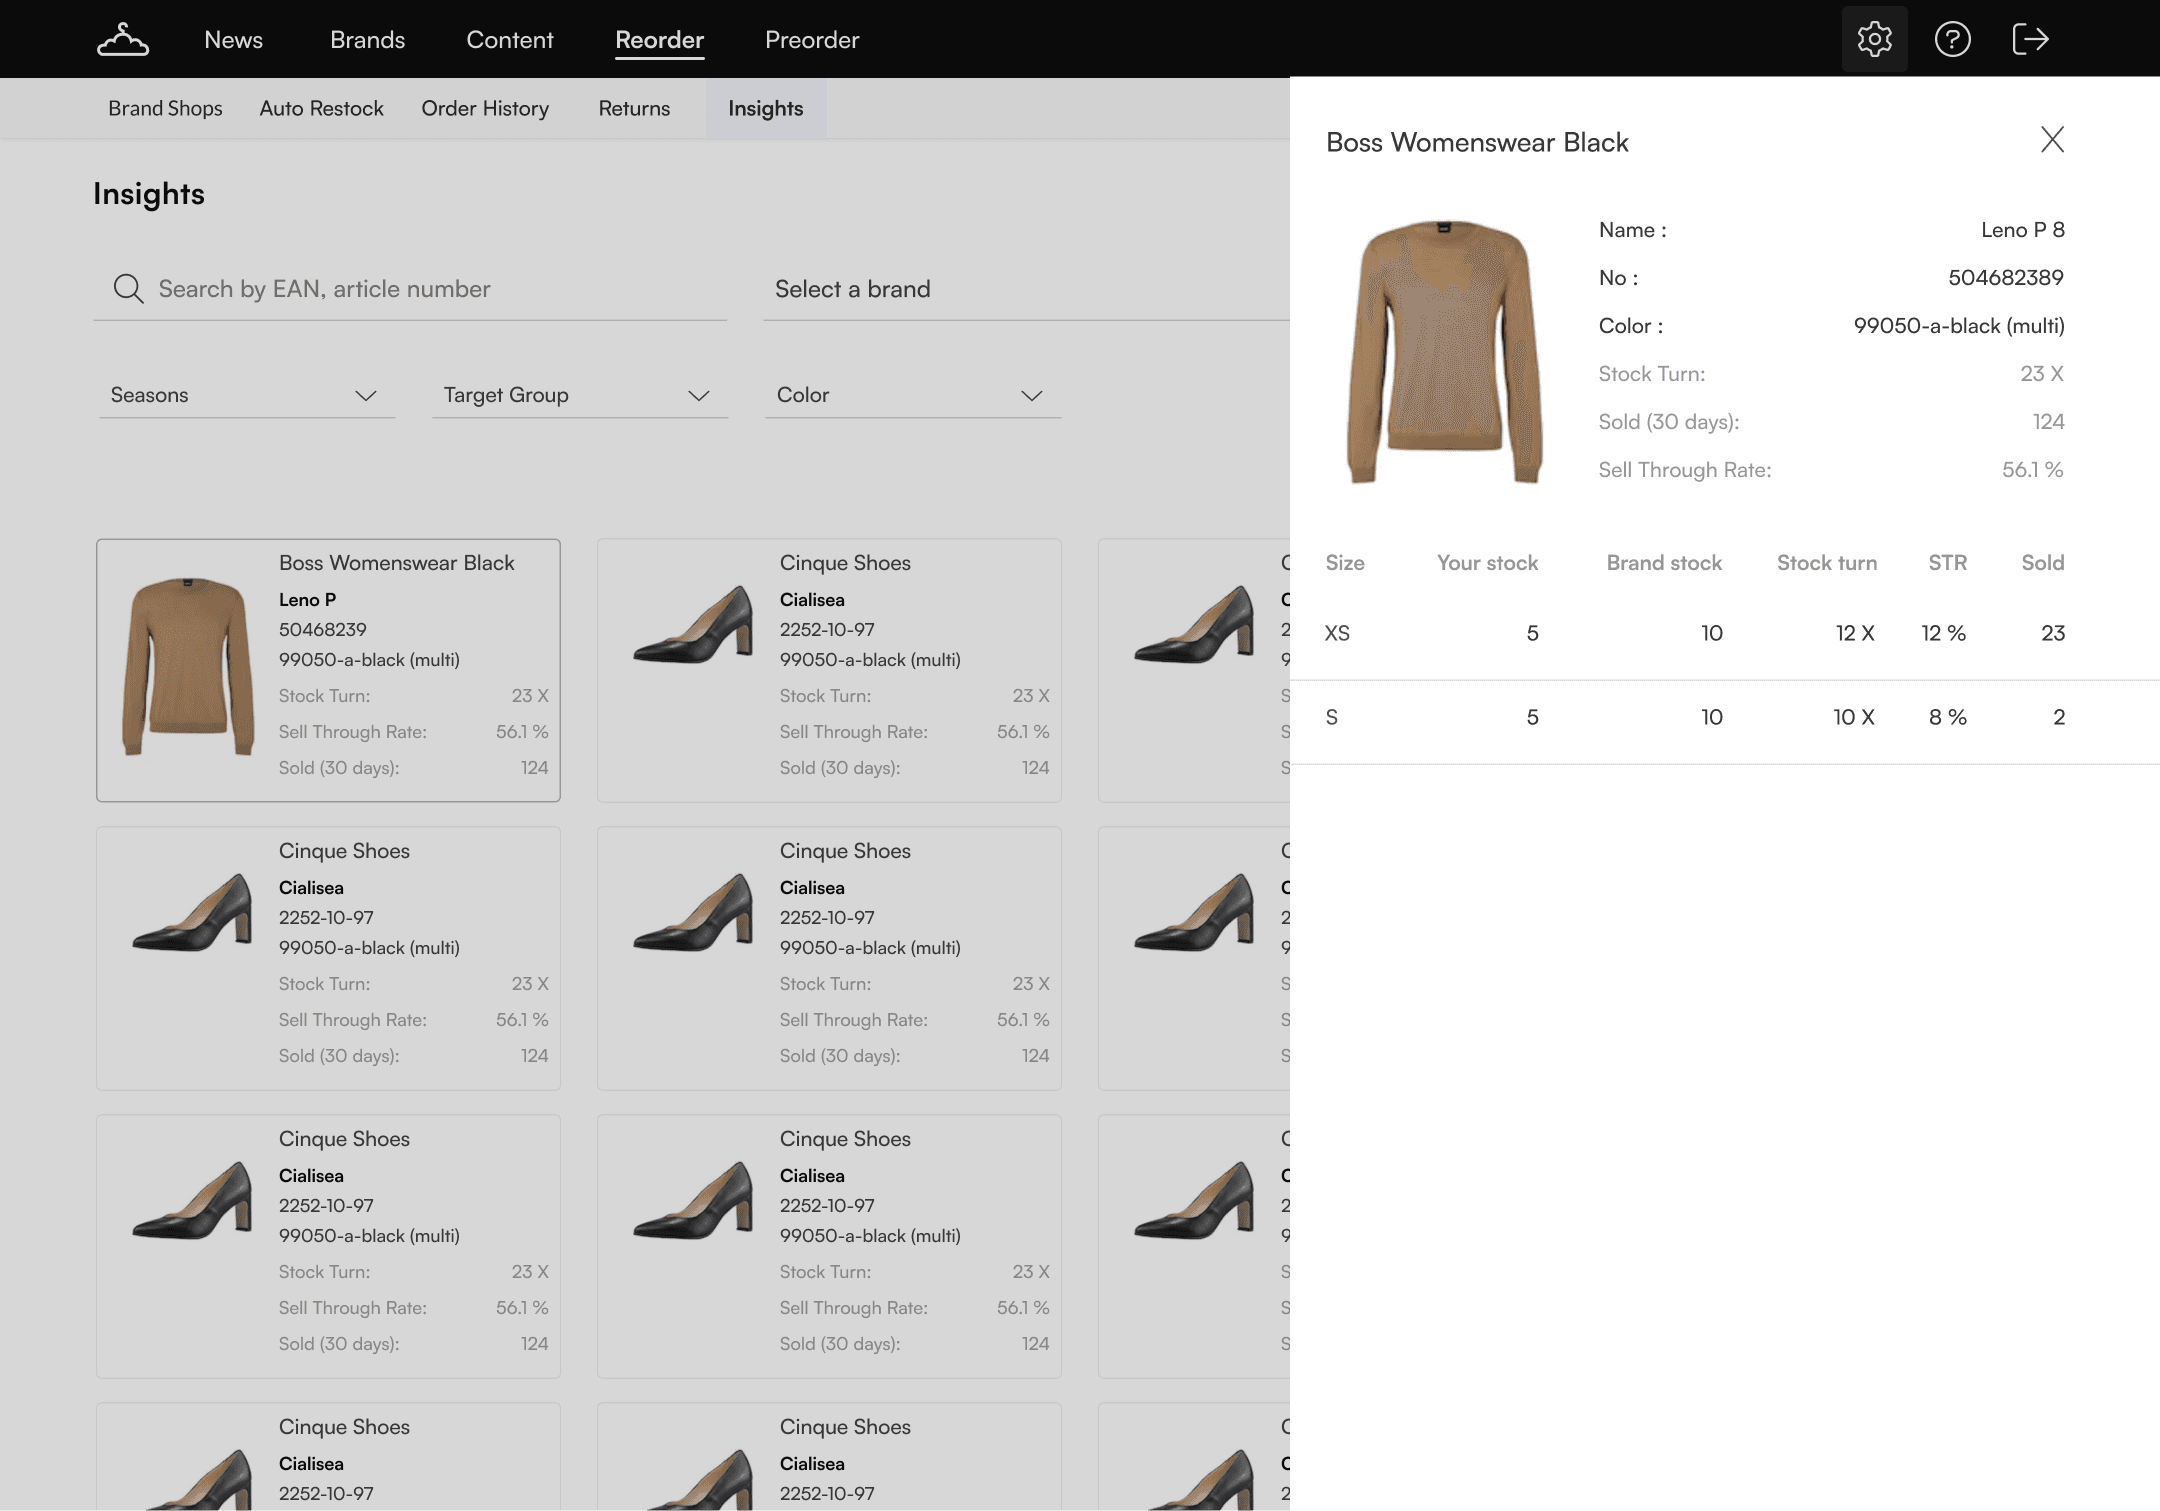
03 I want to dive deeper into my article performance
Bringing the drawer experience from the article experience project,
it was tailored to provide the retailer an unique experience of analyzing articles by providing metrics like Brand stock, Stock turn, STR, Sold as I gathered, that these are the top metrics that the retailers look while making next order decisions.
🔍 Conducting user survey to gather data
It was crucial to ask the right questions to capture the right needs before proceeding to build.
❓Survey questions
What are the most important data points (e.g. Stock Turn, Sell Through, Sold, etc) you use while analyzing the performance of your articles?
How do you analyse the performance across different brands?
How often do you measure an articles performance (e.g. daily, twice a week, weekly, monthly, etc)?
What are the challenges that you face while analyzing an article’s performance?
What insights do you wish your current systems (e.g. ERP) could provide but do not?
🔬Key insights
Stock Turn, Sell Through, Sold, are considered while analyzing the performance of your articles?
50 % retailers did a cross-brand analysis, while 50% retailers compared across categories.
33 % Retailers analysed article performance once in 7 days.
Reports are all over the place, and there is no overview.
Sales insights are not shared.
📊 Using the data to identify needs
Through the above insights, cross brand article performance analysis was identified as a core need, I felt it was important to give the retailers a common view first before they can compare across categories.
This led me to create explorations which catered to the specific usecase of seeing articles across different brands in a singular view
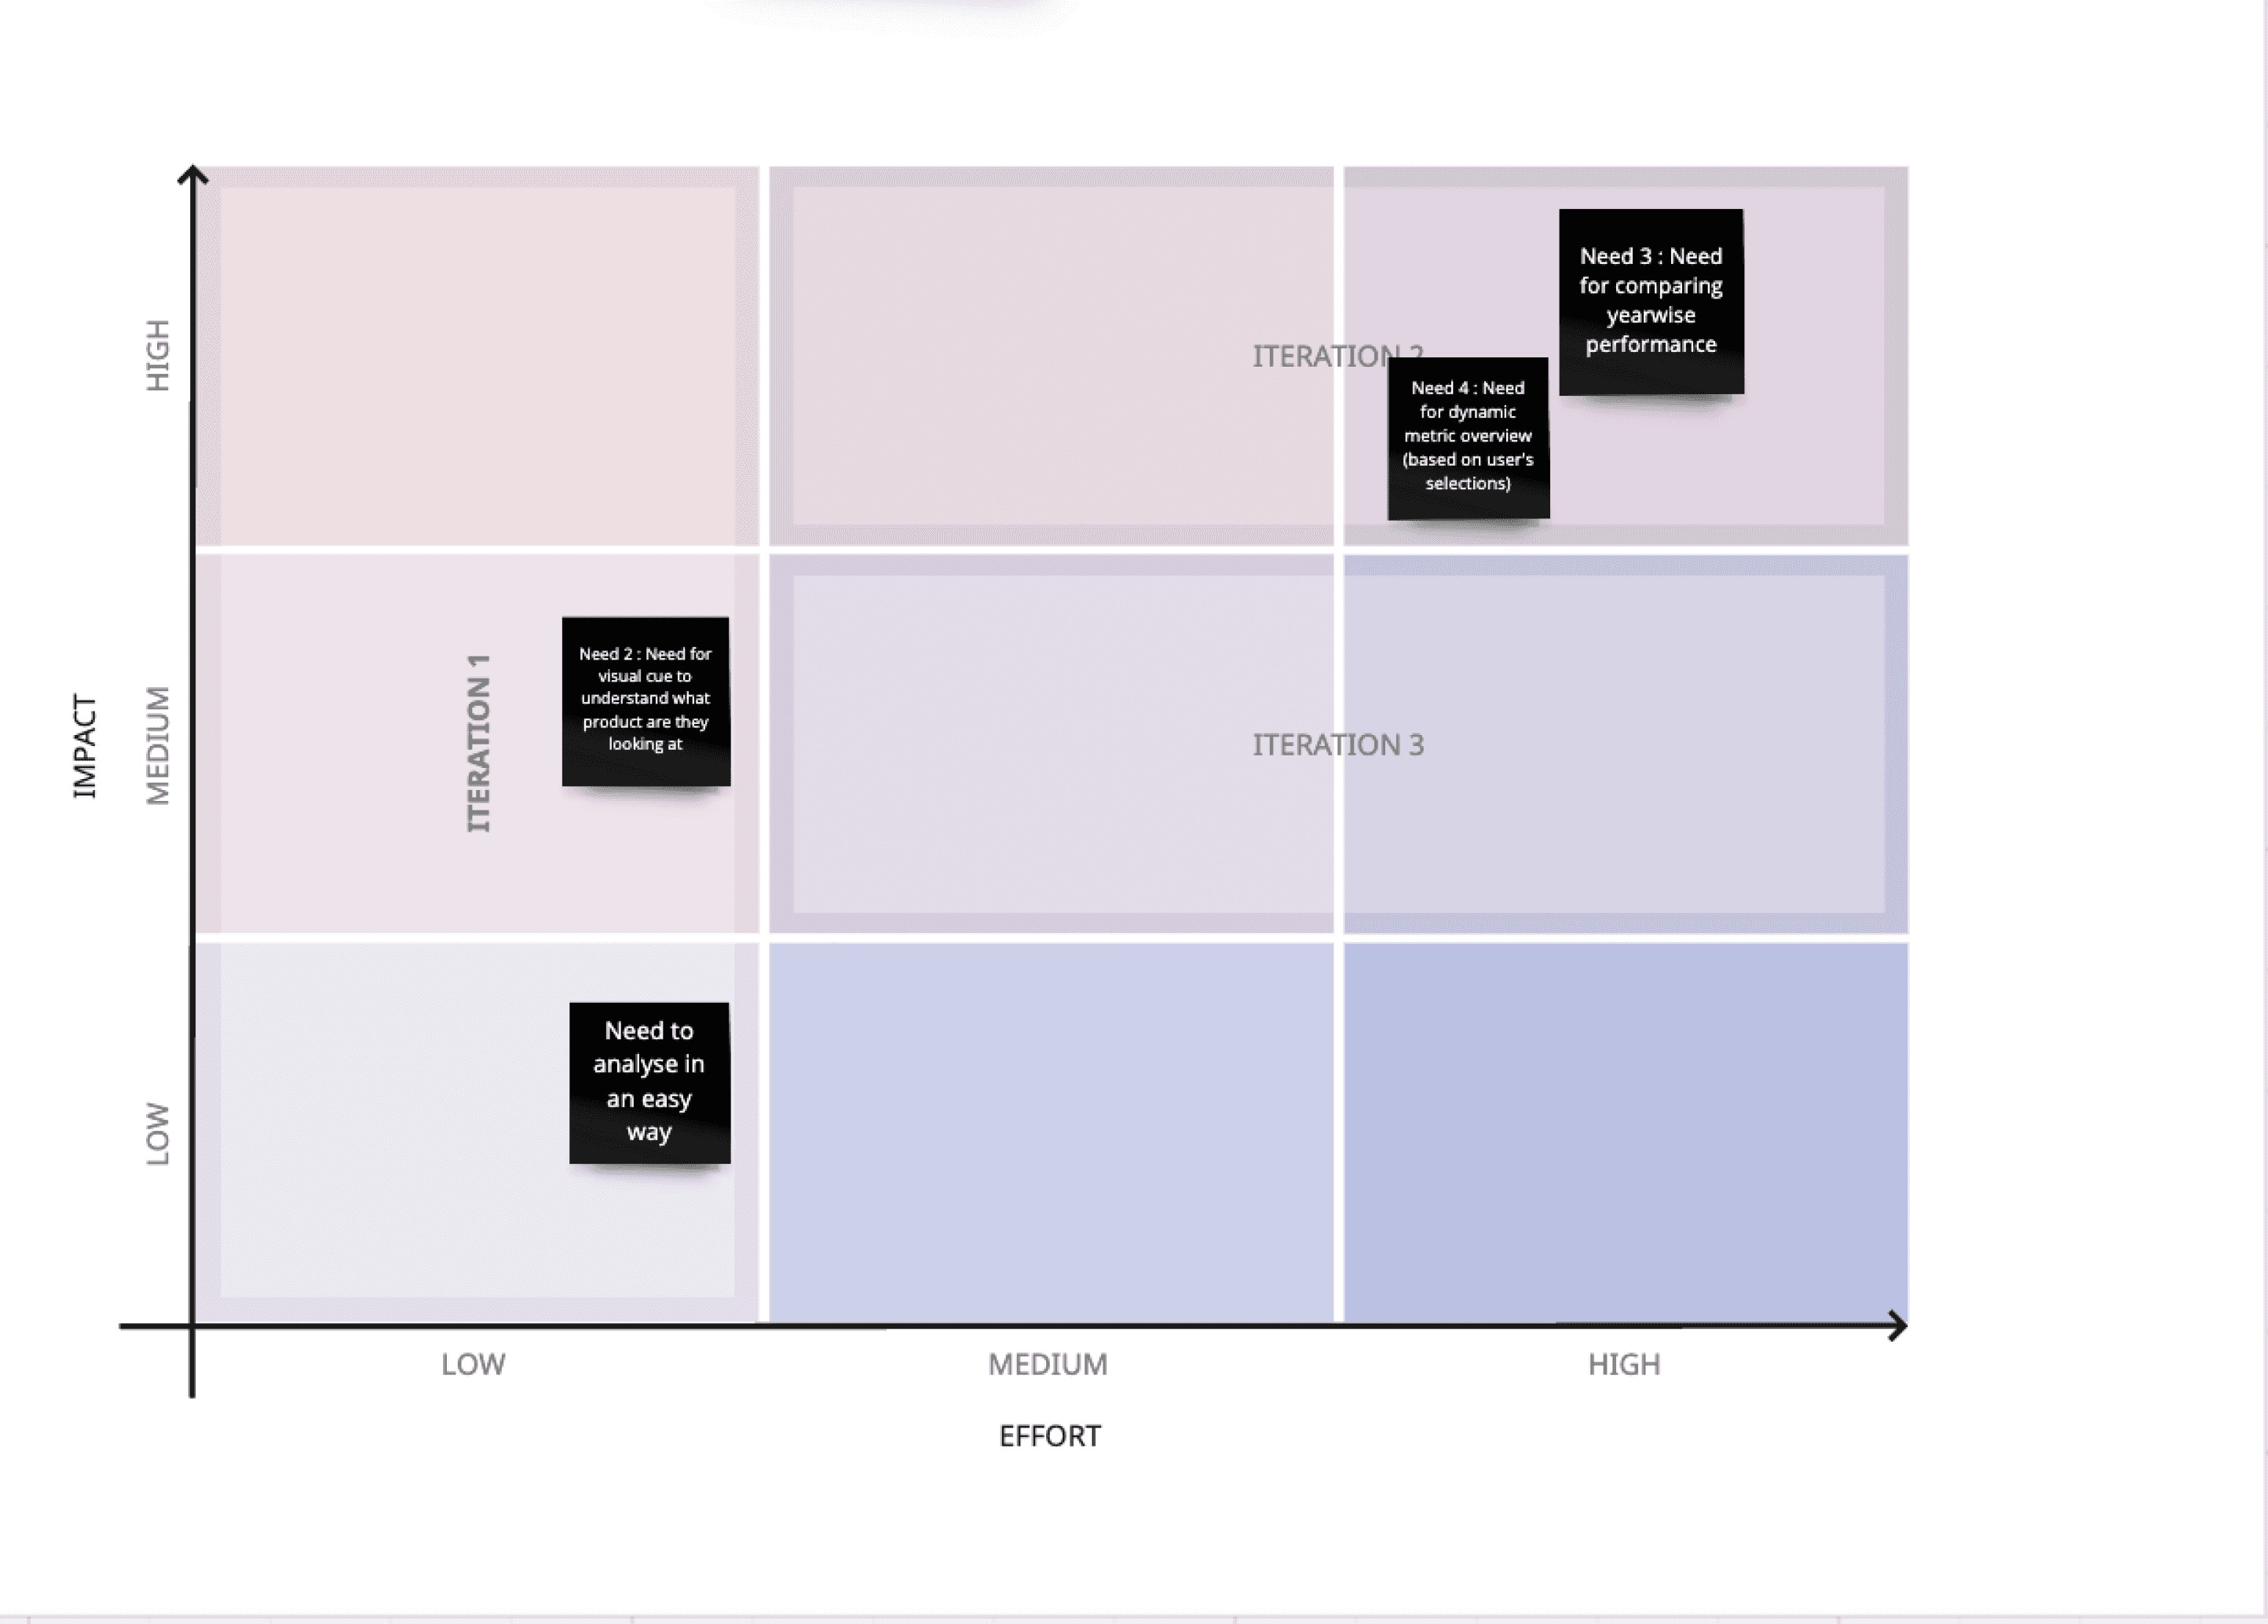
Prioritizing user needs
Building the MVP experience required to identify the urgent needs and prioritize them. I did this by conducting a cross-team brainstorming session and using Impact-effort matrix to map the effort.
I took to Miro to map out different wireframes to visualize. While doing this I made sure I kept it consistent with other platform patterns old & new and kept it as consistent as possible.

🧑🏼🎨 Translating concepts to Hi-fid options
As I made lo-fid wireframes, I shortlisted a few ideas that aligned with the user needs which were outlined at the start of the project.
Note : The data used in the designs are only for placeholder purposes
👨🏻💻 Collaborating with the engineers
As I made the variations, I made sure to take into account the development effort that would be required, allowing me to be mindful of the solutions I presented to the team.
01 Article metrics at individual level
While I kept the card design consistent with the recent design I did for article cards for Suggestions & Auto Restock, I used Typography to create hierarchy in design.
❌ What missed?
Retailer had to put in extra effort to correlate between article name and the brand
02 Average overview of article metrics
I explored showing average overview to allow the retailer have a sense of the metrics on a average level.
❌ What missed?
This was technically difficult as the platform gives metrics only on the article level & would have costed more back end development effort to pull the data, so it was parked as an idea for the future.

03 Sort metrics in detailed view
I explored being able to sort the table to allow the user have some flexibility in terms of analysing the metrics.
❌ What missed?
Part of the feedback involved that constant shuffling of the values might have added friction to the user experience hence we decided to park this feature.

Design system update
During this project, parallely the company also underwent a major re-branding. This allowed me to apply the revised language to the new product offering.
👀 Maintaining accessibility
During the project, I strived to maintain the overall accessibility by achieving AA- AAA compliance by constantly checking for readability using contrast checkers
The drawer view also allows to navigate between different sizes using keyboard keys which improved the navigation by 40%
🧪 Internal A/B Testing to iterate quickly
I tested internally with a wide range of stakeholders especially non-product roles like Customer Success Managers.
One of the key feedbacks were, the German retailers would expect a dashboard of charts compared to Dutch retailers, this motivated me to influence their thought process by sharing the pros and cons during design reviews where I shared it was important the experience remains consistent across regions
01 Article + Brand + Details
In the first option, I allowed the retailer to scan via article names followed by the brand
02 Brand (Bold) + Article + Detail
In the second one, I assumed, it would be easier to recall a brand instead of an article name.

03 Brand + Article (Bold) + Details
In the third exploration, brand name serves the primary role, however I also gave importance to article name by using a bold weight which gives it the secondary role.

Key internal stakeholder feedback
Prioritize the brand name visibility, while placing article name at a lower but important level.
🎯 Aligning design & business value
Towards the end of the project, I made sure the solution not just solved for ease of use but also catered to the business goal the team started out with, i.e. increasing user engagement on the platform along with increased customer onboarding.
01 Guiding a new retailer to join the Insights
Allowing the retailer to sift through the feature values and nudge them to reach out to one of the customer representatives significantly led to highly "Sign Up" requests by 60%.

✅ What worked?
Simple onboarding flow can help the retailers to understand what service value before they decide to use Insights.
💼 Business goal
Through this flow, I aimed to achieve increase in customer onboarding which was one of the business goals.
02 Diving deep in an article performance
Keeping a consistent pattern across the platform, I reused the drawer pattern enabling the retailer to dive deeper at a size level performance. This aimed to engage the customer.

✅ What worked?
The insights experience is consistent with Suggestions and Auto Restock experience allowing for minimal learning curve.
💼 Business goal
We target to achieve the goal of driving increased revenue by allowing retailers to use Fashion Cloud for it’s analytics services.
🛠️ Insights edge cases
I considered the following for the future product roadmap,
What happens when a retailer wants to compare articles across different brands?
How can retailer analyse article performance across different stores from the same brand?
What if the retailer wants to see a trend in form of data visualization, how can the platform support it?
What if the retailer wants to share the performance data with the respective brand, is there a way to export it?
What if the retailer wants to compare same article performance across different brands?
👩🏻🏫 Learnings
This project taught me to value Time to market and use user feedback constantly to drive the design. I also was able to lead the UX research efforts and bring a lot of insights to the team which was helpful in shaping the design strategy.
🔮 Future design considerations
01
Allow retailers to compare articles across brands and stores
02
Allow retailers to compare articles across categories
03
Allow retailers to see data through visualisation on the platform
🧑🏼🎨 Impact as a designer
01 Work
What did I do?
Worked on a high quality solution to a known retailer problem of not being able to analyse article performance, drove project progress, shipping in high quality.
02 Output
What did I deliver?
Insights overview feature for retailers to see article performance across brands.
03 Outcome
What does it achieve?
Problem of having article performance metrics in one place is solved delivering faster analysis workflow for retailers.
04 Impact
What does it change?
Onboard higher number of retailers onto the platform leading to increase in revenue.
The solution allows the retailers to be in sync with their article performance and use it to communicate with the brand while placing orders.
Thank you for reading!
Did this pique your curiosity? Say a hello or check another project to know more!
Made with love & coffee
Amsterdam & India